
When Yankees’ outfielder Spencer Jones made his MLB debut back in May, many people, including myself, were skeptical that his approach would work at the MLB level. While he had succeeded in the minors, he was older than most of his opponents and had displayed real issues with contact and strikeouts. It didn’t seem like a profile that would translate well and, early on, that was proven to be correct.
In his first 82 plate appearances, Jones hit .233 with a 41.5% strikeout rate, a 21% swinging strike rate, and well below-average contact rates and zone contact rates. The Yankees demoted him to Triple-A at the beginning of July, and it seemed like he may not be part of the team’s plans moving forward.
Yet, since coming back up on July 22nd, Jones is hitting .261/.326/.472 with eight home runs, 30 RBI, and eight steals. That has come with a 33.5% strikeout rate and a 19.5% swinging strike rate, but also a 77% zone contact rate that is better than many expected him to produce. So is this sustainable? Can Jones keep producing at this level with his strikeout rates and swinging strike rates as elevated as they are?
To answer that question, I not only went to the data, but I watched the vast majority of his at-bats since July 22nd, thanks, in huge part, to my buddy Nick Pollack, who gave me access to a pitcher database where you can watch specific at-bats. We don’t have to tell Nick that I watched it for a hitter instead of a pitcher. Regardless, this article is now a combination of what the data and my own eyes tell me about whether or not my Spencer Jones skepticism was off base and if he can be a true difference-maker for the Yankees during his career.
The Results Don’t Lie – He Hits the Ball Incredibly Hard
We have to start with the results because if they weren’t what they are, nobody would be asking this question. We already talked about Jones’ stat line and his contact rate since returning to the Yankees’ roster. We should also note that he has a 19.4% barrel rate, 51.5% hard-hit rate, and 77 mph bat speed in his 179 plate appearances. All of that is beyond elite. No matter where he makes contact with the ball (except maybe up-and-in), he’s crushing it.
Despite also having a .362 BABIP over this stretch, Jones is not getting lucky, according to Statcast, which gives him a .266 xBA and a .520 xSLG. At bare minimum, it means that Jones’ performance is not obviously flukey based on batted ball data. His .362 BABIP may regress closer to the league average of .290 over this stretch, but the rest of the results aren’t screaming red flags. Which means we can start digging into the details with a slight lean towards an optimistic view on Jones.
Jones Crushes Fastballs But Can He Handle Other Pitches?
As you might expect from a player with Jones’ raw power, he handles fastballs, both four-seamers and sinkers, exceptionally well. Heading into Wednesday’s game against the Twins, Jones had a .936 OPS since July 22nd against four-seamers, with a 96.0 mph average exit velocity, 22.7% barrel rate, and 54.5% hard-hit rate. That’s genuinely elite contact quality. His expected batting average against four-seamers was .426, which was notably higher than his .317 actual average, which supports that he has been hitting four-seamers as well as you could expect a hitter to.
In a much smaller sample size, Jones’ sinker results look even better, with a 1.103 OPS, 99 mph average exit velocity, and 66.7% hard-hit rate. Of course, he has only seen 67 sinkers, so we need to take that with a grain of salt, but it’s notable that both the fastball and sinker feature the lowest swinging strike rates for Jones among all of the pitches he has faced regularly (he didn’t face enough splitters for me to include the data).
| Pitch Type | Pitches Seen | BA | OPS | SwStr% | Avg Exit Velo | Hard-Hit% | Balls In Play | Expected BA (xBA) |
| Four-seam | 288 | 0.317 | 0.936 | 13.5% | 96.0 | 54.5% | 44 | 0.426 |
| Changeup | 103 | 0.160 | 0.512 | 31.1% | 89.8 | 41.7% | 12 | 0.398 |
| Slider | 90 | 0.227 | 0.655 | 25.6% | 94.1 | 46.2% | 13 | 0.402 |
| Sinker | 67 | 0.286 | 1.103 | 10.4% | 99.0 | 66.7% | 9 | 0.595 |
| Curveball | 49 | 0.100 | 0.200 | 26.5% | 88.3 | 50.0% | 6 | 0.304 |
| Sweeper | 34 | 0.625 | 1.625 | 17.6% | 88.7 | 42.9% | 7 | 0.433 |
As you can see from the pitch samples, again, before Wednesday’s game, Jones has seen four-seamers nearly three times as often as any other single pitch. That’s a curious decision from pitchers given the amount of damage he does against them, but that’s a conversation for another time.
We can also notice from the chart that Jones’ hard-hit rate is genuinely strong against all pitch types. However, the swinging strike rate gets significantly worse, particularly on changeups, where Jones has a 31.1% mark. Considering he has seen over 100 changeups, that is likely not a small-sample-size data error; Jones really struggles against changeups. Similarly, in a much smaller sample size, he has struggled to make contact with curveballs, but has hit them hard, so this all jives pretty cleanly with the idea that Jones has tons of power in his bat, but struggles to make consistent contact. If he were to start seeing far fewer four-seamers, how would he handle that?
Contact Rate and Swing Decisions Concerns
Earlier, I mentioned that Jones’ 77% zone contact rate over this stretch was far better than I expected him to produce. While that’s true, we also need to highlight that the MLB average zone contact rate over the same sample size is 87.1%. Similarly, his 19.5% swinging strike rate is well above the 10.8% league average, and his 64% contact rate overall is below the league average of 77.4%. No matter which way you slice it, Jones is far below the league average when it comes to his contact ability, even when he’s producing such elite results.
In fact, over this stretch, only Munetaka Murakami and Esmerlyn Valdez have a lower contact rate among the 168 qualified hitters in all of baseball. Jones ranks 166th out of 168 qualified hitters in contact rate despite his scorching results at the plate. Similarly, his 77% zone contact rate, which we lauded, ranks 161st out of 168 qualified hitters.
In particular, he seems to have a weakness up in the zone and particularly up-and-away. As you can see in the Statcast zone breakdowns below, Jones whiffs more at the top of the zone than anywhere else, and he produces poor batted ball results at the top of the zone. That might be why he sees so many fastballs, but if pitchers aren’t able to locate successfully up in the zone, Jones can punish pitches in the middle of the zone and also low. However, these charts seem to show some real weak points where pitchers could attack the rookie.

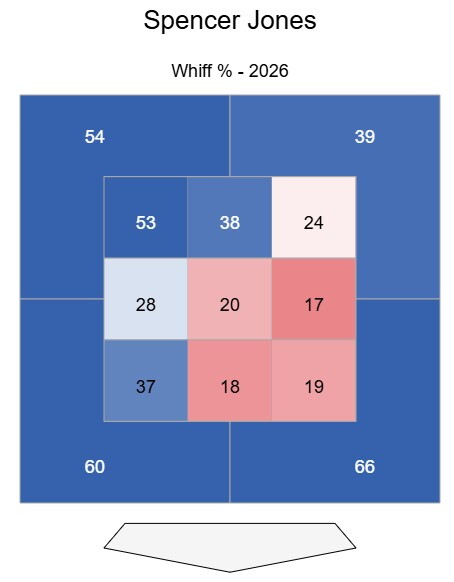

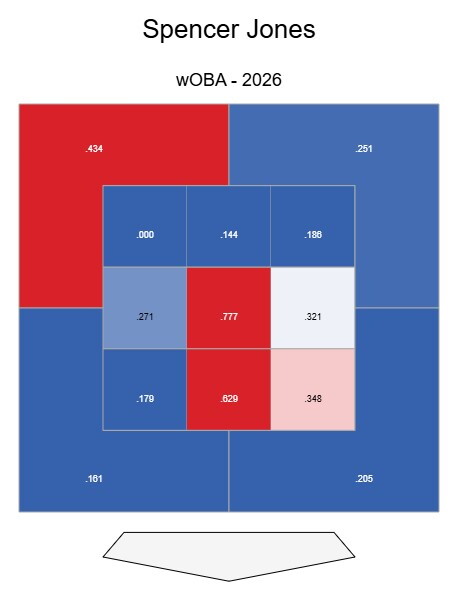
Some of Jones’ contact concerns come down to swing decisions. Jones has a chase rate of 37.9% over this stretch, which is the 39th-most among the same 168 qualified hitters. Jones also sees his chase rate climb as he gets deeper into the count. It’s 36.6% when he’s ahead in the count, 38.7% when he’s in an even count, and 40.2% when he’s behind in the count. All of that is compared to the league average chase rate over the same sample size of 33.2%. While it’s natural for hitters to expand the zone more to try and protect the plate in two-strike counts, we have to acknowledge that Jones expands the zone far more than average in all counts.
Part of that is aggression. He has a 53.7% swing rate over this stretch that ranks 23rd among the same batch of qualified hitters. The league average swing rate is 47.6%. Yet, swinging more often makes sense for Jones. We’ve seen plenty of hitters with poor contact profiles swing more often because it gives them more chances to make contact and do damage. That aggression is not necessarily a negative for him so long as it results in early swing and misses that give him extra chances to hit and not weak contact that ends an at-bat.
That might also be why Jones gets even MORE aggressive with runners in scoring position, where his swing rate increases from 51.2% to 59.5%, and his chase rate climbs from 36.6% to 44.4%. When you pair that with the fact that his contact rate and swinging-strike rate are both also worse with runners in scoring position, you’d think Jones struggles there, but he actually entered Wednesday’s game with a .378 batting average and 1.158 OPS with runners in scoring position. That’s compared to a .211 average and .657 OPS with the bases empty. His aggression in those situations has potentially been the cause of his success.
This also isn’t luck. He may be getting overly aggressive with runners in scoring position and expanding the zone a lot, but when he puts the ball in play in these spots, he’s genuinely crushing it. He has three home runs in these situations, and all three were balls that were 104.6 mph or harder. He has singles that registered 105.9 mph, 102.2 mph, and 108.5 mph. In fact, he has only one poorly hit base hit with runners in scoring position over this whole sample, which was a 53.1 mph roller with a -28° launch angle that found a hole for a single.
So, yes, his contact rates and swing decisions are not good. But also, no, that has not been hurting his overall performance.
He Is Willing to Make Two-Strike Adjustments
Another factor that points towards Jones’ results being genuine is that he has shown the desire to change his approach in two-strike counts. That’s good because he gets into a lot of them. Since July 22nd, 60% of Jones’ plate appearances reach a two-strike count. The league average is 52.7%. We obviously mentioned his aggression earlier on in this article, and we know that Jones swings and misses a lot, so it makes sense that he would get behind in the count often.
Yet, when his aggression works for him, it works in impressive ways.
In the 40% of plate appearances where Jones avoids a two-strike count, he has hit .460 with a 1.341 OPS and a 50.8% hard-hit rate. Now, we need to note that a 1.341 OPS in 63 at-bats is an extreme number that we should expect to come back down to earth as the sample grows. That’s not because Jones is bad, but because numbers this high rarely hold at that level over a larger sample size.
Now, when Jones does get into two-strike counts, his bat speed, swing length, and swing tilt are all essentially unchanged, which means he’s not making any glaring mechanical changes depending on the count. However, his attack angle, which measures the vertical angle of the sweet spot of the bat when it passes through the contact point, is over two degrees flatter in two-strike counts. That may be a small sample size fluke, but it also may be evidence that Jones is trying to create a flatter bat path when he gets behind in the count.
Another data point that supports that notion is that Jones’ best contact rate comes in two-strike counts. Now, it’s still just 71.3%, and his swinging strike rate in two-strike counts remains 16%, but those are noticeable improvements from what he’s doing in other counts. This supports the idea that he is tightening up his swing and focusing on making contact in these situations. That contact has produced just a .481 OPS, which is a huge gap of about .860 points between his two-strike and non-two-strike OPS; however, we can’t drag a guy for not making enough contact and then also drag him when he changes his swing to protect the plate and make more contact. It’s clear that Jones has the mature understanding that he needs to change his approach with two strikes, and that points to continued development from him in the future.
Is On the Extreme End of a Common Profile
In order to see which hitters Jones most closely resembles, I sorted by hitters who were in both the top quartile in swinging strike rate (negatively), zone contact rate (negatively), and the top quartile in hard-hit rate (positively). I found 33 hitters who have similar types of profiles to Spencer Jones. A lot of them are names you’d likely have imagined, and even after I removed a few of them because they either didn’t hit the ball hard enough or made too much contact in the zone, we had an intriguing list to compare to.
| Player | SwStr% | Hard-Hit% | Zone Contact% |
| Esmerlyn Valdez | 14.9% | 49.3% | 71.3% |
| Munetaka Murakami | 15.9% | 57.1% | 71.3% |
| Luke Raley | 20.6% | 47.1% | 76.9% |
| Spencer Jones | 19.5% | 54.3% | 77.0% |
| Nick Kurtz | 14.1% | 57.3% | 77.5% |
| Garrett Mitchell | 14.5% | 53.1% | 80.0% |
| Griffin Conine | 16.9% | 49.7% | 80.1% |
| Oneil Cruz | 14.5% | 55.4% | 80.2% |
| Kyle Stowers | 17.5% | 56.5% | 82.1% |
| Kyle Schwarber | 13.3% | 49.9% | 82.3% |
| Jordan Walker | 15.3% | 48.9% | 82.6% |
| Jake Burger | 16.5% | 46.3% | 82.8% |
| Corey Seager | 14.9% | 48.4% | 84.3% |
| Henry Bolte | 15.1% | 47.8% | 85.3% |
| Heliot Ramos | 13.2% | 50.4% | 86.2% |
| Jac Caglianone | 14.9% | 54.5% | 87.2% |
As you can see, even from this list of outliers, Jones is an outlier himself. He has the 4th-lowest zone contact rate (77%) in the entire 33-player group, basically tied with Luke Raley. Only Esmerlyn Valdez and Munetaka Murakami have been worse among this group. Both of those two hitters had better swinging-strike rates than Jones, whose swinging strike rate is second-highest on this list, trailing only Raley. Of course, on the flip side, only five hitters in the 33-hitter sample had a higher hard-hit rate than Jones, which puts him as a positive outlier too. All of which is to say that Jones, even during his recent hot streak, has proven to swing and miss an extreme amount, both overall and in the zone, but also hit the ball incredibly hard when he does make contact.
I found the comparisons to Esmerlyn Valdez and Munetaka Murakami to be interesting because both have proven to be incredibly streaky this season.
In his first 74 games of the season, Murakami hit .244/.382/.553 with 24 home runs and 51 RBI. That came with a 20.1% barrel rate and 60.4% hard-hit rate. He was among the most elite power hitters in the game. That’s also a 344 plate appearance sample, so almost double Jones’ 179 plate appearances. Murakami’s 16.3% swinging strike rate was better than Jones’ mark by over 3%; however, Murakami had a far worse 70.3% zone contact rate and a slightly worse 60.4% contact rate.
It appears that his hamstring injury, or poor contact rates, caught up with Murakami, who has hit .131/.277/.301 with seven home runs and a 42% strikeout rate in 184 plate appearances since August 1st. His zone contact rate is an identical 70.4% over that stretch, and his contact rate fell to 59.2%. It’s unlikely that Jones would experience that kind of regression since his zone contact issues are not as pronounced as Murakami’s.
The same could maybe be said for Valdez, who was also called back up after a rough first MLB sample size, and hit .310/.406/.716 with 12 home runs and 32 RBI in his first 138 plate appearances from June 22nd on. Remember that this sample size for Jones is 179 plate appearances, so Valdez wasn’t as hot for as long, but it’s a closer gap than Murakami. Valdez also, like Murakami, scorched the ball with a 24.7% barrel rate and 51% hard-hit rate, but also posted a 73% zone contact rate and 66% contact rate overall. Interestingly, that means Valdez had a better swinging strike rate and overall contact rate than Jones over his sample size; however, Valdez also had more issues with contact in the zone.
In 123 plate appearances since August 1st, Valdez has hit .178/.317/.317 with three home runs and a 41.5% strikeout rate. Even though his profile is more similar to Jones’ than Murakami’s, I still don’t think it’s quite a fair comparison because Jones has had better zone contact rates, so he may not have regression hit him as hard as those two players did.
So who does Jones most closely resemble?
That hard truth is that the answer is really “Nobody.” Jones combines three separate extremes at the same time, which appears to be rare when you look at the hitters on this list. Most of these hitters, who are already elite power hitters with some contact concerns, have two extreme outcomes but are closer to league average in a third. For example, Nick Kurtz has a near-identical zone contact rate to Jones and only slightly better hard-hit rates, but a significantly better swinging strike rate. Kyle Stowers has a hard-hit rate that resembles Jones’ and also has an elevated swinging strike rate, but both of those marks are better than Jones’, and Stowers also has a 5% better zone contact rate.
Jones’ basic archetype of being a high-whiff, big-power hitter isn’t rare, but when factoring in zone contact, he struggles to make contact on pitches he should be able to handle at a rate that’s similar to almost no other hitter who also hits the ball this hard. Your closest comparison might be Griffin Conine or maybe Luke Raley with more pop and athleticism (meaning, he can actually play defense).
We need to be clear that this isn’t who Jones WILL BE. He’s 25 years old, so there is a world where he continues to improve and adjust to MLB pitching and comes closer to an Oneil Cruz type of profile; although, even that would require a 5% decrease in swinging strike rate. He should also note that Cruz has a career slash line of .241/.320/.436, so even if we’re saying the contact profile for Jones could grow into becoming more than Cruz, that would likely still result in a far lower batting average over a full season.
Final Takeaway
At the end of the day, Spencer Jones is a truly unique player. We’ve really yet to see somebody who truly resembles his profile as closely as we’d like. However, we can say that he’s clearly better than I, and many others, thought he’d be at the MLB level. That needs to be said directly and outright if we’re being honest in our takeaways from this research. I thought his contact profile would be so poor that he would rarely be able to make enough useful contact to be an MLB regular. I underestimated the quality of contact that he is able to make when he does square up the ball.
However, I do maintain my belief that contact rate wins out in the end. I’ve just seen it too many times over all my years playing, watching, and writing about baseball. It’s nearly impossible for a player to maintain consistent, year-after-year production with bottom-tier contact rates. Major League pitchers are simply too good, and they find a way to exploit it.
That being said, I think it’s fair to come away from this believing that Jones is an MLB regular. He possesses good speed and a solid enough defensive profile that I think you can play him as one of your regular outfielders. He has also hit left-handers well enough in a small sample size that you may not need to force a strong-side platoon on him. However, I think there’s also a strong argument that we’re seeing the best stretch he’s going to have. Considering that stretch has a .261/.326/.472 slash line, we might see Jones settle in as a .240 type of hitter.
There are plenty of those types of hitters who are impactful MLB players: Oneil Cruz, Kyle Schwarber, Max Muncy, Hunter Goodman, etc. Jones will need to continue to make strides to get near that tier of player, but he’s showing that it may not be as impossible as I had believed. Although maybe still a little improbable.
Read the full article here